Discover the most compelling infographic statistics and visual content trends with this informative infographic from SearchLogistics. Designed for marketers, content creators, bloggers, educators, and business owners, the infographic highlights why …
Read More…
The Marriott Bonvoy 2026 Ticket to Travel infographic reveals key travel trends shaping the future of tourism in 2026. Based on research conducted among 2,045 adults in South Africa (July …
Read More…
This Travel Money Safety and Financial Scams infographic provides essential tips for protecting your money while traveling abroad. Designed as a practical visual guide for international travelers, tourists, students, and …
Read More…
This Staying Safe While Traveling infographic provides essential travel safety tips for tourists, business travelers, students, and families planning trips abroad. Designed as an easy-to-follow visual guide, the infographic outlines …
Read More…
The European Union infographic “Breaches of EU values: how the EU can act” clearly illustrates the mechanisms the EU uses when a member state violates the core principles of the …
Read More…
The Green Agenda for the Western Balkans (GAWB) sets a clear pathway for sustainable development while protecting nature and biodiversity across the region. Fully aligned with the EU Green Deal, …
Read More…
If you’re waking up sore, restless, or feeling like your mattress just isn’t cutting it anymore, it might be time for a change. This infographic guide explains how replacing an …
Read More…
The infographic explores how music education is delivered in Australian primary schools, drawing on a survey of more than 700 primary school teachers from 95 schools in New South Wales. …
Read More…
This infographic highlights 10 years of Samsung Family Hub innovation, showcasing how the smart refrigerator has evolved into a true home companion. It begins by presenting three core pillars—Screen, Camera, …
Read More…
This infographic, titled “X-Mas Without a Tree?”, provides a data-driven overview of how Christmas tree shortages, inflation, and supply chain disruptions are impacting the holiday season in the United States. …
Read More…
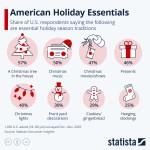
While holiday traditions vary from household to household, the infographic below highlights the Christmas essentials that most Americans agree define a truly festive season. Based on data from Statista Consumer …
Read More…
The infographic titled “BRICS vs the West: The Gold Divide” illustrates the growing divergence between BRICS nations and Western countries in terms of gold accumulation and reserve strategy. It highlights …
Read More…
Understanding how modular housing compares to traditional construction helps homeowners make more confident choices. Modular builds benefit from controlled factory production, shorter timelines and steady quality checks. Traditional builds allow …
Read More…
The infographic from Sunny Bites compares two cookie products—Choco Fill and OG Cookie—to reveal how traditional costing can misrepresent profitability. It begins by outlining each product’s production process: Choco Fill …
Read More…
This infographic presents a clear, data-driven overview of healthcare spending in the United States. It highlights that total healthcare expenditures reached 18% of the U.S. economy in 2023 and shows …
Read More…