
The European Union infographic “Breaches of EU values: how the EU can act” clearly illustrates the mechanisms the EU uses when a member state violates the core principles of the …
The European Union infographic “Breaches of EU values: how the EU can act” clearly illustrates the mechanisms the EU uses when a member state violates the core principles of the …

The Green Agenda for the Western Balkans (GAWB) sets a clear pathway for sustainable development while protecting nature and biodiversity across the region. Fully aligned with the EU Green Deal, …

If you’re waking up sore, restless, or feeling like your mattress just isn’t cutting it anymore, it might be time for a change. This infographic guide explains how replacing an …

The infographic explores how music education is delivered in Australian primary schools, drawing on a survey of more than 700 primary school teachers from 95 schools in New South Wales. …

This infographic highlights 10 years of Samsung Family Hub innovation, showcasing how the smart refrigerator has evolved into a true home companion. It begins by presenting three core pillars—Screen, Camera, …

This infographic, titled “X-Mas Without a Tree?”, provides a data-driven overview of how Christmas tree shortages, inflation, and supply chain disruptions are impacting the holiday season in the United States. …
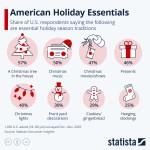
While holiday traditions vary from household to household, the infographic below highlights the Christmas essentials that most Americans agree define a truly festive season. Based on data from Statista Consumer …

The infographic titled “BRICS vs the West: The Gold Divide” illustrates the growing divergence between BRICS nations and Western countries in terms of gold accumulation and reserve strategy. It highlights …

Understanding how modular housing compares to traditional construction helps homeowners make more confident choices. Modular builds benefit from controlled factory production, shorter timelines and steady quality checks. Traditional builds allow …

The infographic from Sunny Bites compares two cookie products—Choco Fill and OG Cookie—to reveal how traditional costing can misrepresent profitability. It begins by outlining each product’s production process: Choco Fill …

This infographic presents a clear, data-driven overview of healthcare spending in the United States. It highlights that total healthcare expenditures reached 18% of the U.S. economy in 2023 and shows …

This striking infographic, created by the marketing team at Unitel Voice, spotlights five unconventional startup ideas that became multi-million dollar success stories. It illustrates how a simple yellow smiley face, …

The marketing team at Unitel Voice, the virtual phone system for business builders, created this insightful infographic to highlight nine surprising statistics about entrepreneurs. At its core, the graphic busts …
This infographic, created by the IAPP’s Privacy Bar Section Advisory Board, offers a clear, structured guide for early-career professionals pursuing a path in privacy law. It highlights core skill areas …

This infographic presents 8 essential tips to strengthen Azure Cloud security, offering practical steps to protect sensitive data and resources in the cloud. It begins with enabling multi-factor authentication (MFA), …