
A company’s first image is usually its website. Having a great website automatically sends a positive vibe to your visitors and enhances a level of professionalism. Making a great and …
A company’s first image is usually its website. Having a great website automatically sends a positive vibe to your visitors and enhances a level of professionalism. Making a great and …

The first thing which we should consider to crush sale is to be 100% committed. Prove others that your action speak louder than words. Most of the buyers believe that …

These days, school bus is considered as the safest mode of transportation for school going children. When you choose school bus for your children, it is natural for you worry …

Are sick days taking over your office productivity? Do you want employees to be happier, healthier, and more efficient? Then, office cleaning is the way to go. Profits will be …

Are you and your spouse heading down the path of divorce? You may be wondering if now is a good time because of the kids? What about their school? Your …

An infographic showing the basic living costs in 5 of Canada’s most popular cities – Toronto, Vancouver, Montreal, Calgary and Ottawa. You can compare prices for items such as food, …

Lanyards have been around for decades both as a promotional item and as a security and identification product. There aren’t many products that can display a brand name to potential …

For novice marketers, personalization when it comes to email marketing is just about addressing the person in the email’s salutation. Today, personalization can go beyond changing the name. It is …

The most up to date and comprehensive infographic on SEO that’s relevant up to 2018 (and beyond). There’s something for everyone, from beginner SEO favourites (duplicate content, anyone?) to advanced …
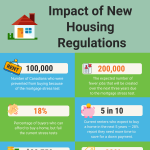
Rising interest rates and new mortgage rules are hurting prospective buyers who dream of homeownership. New research from Will Dunning, chief economist for Mortgage Professionals Canada, shows that prospective buyers …

With how integrated artificial intelligence is in our lives, the need for explainability and transparency behind AI is more important than ever. If a telecommunications agency, for example, uses AI …

Did you know skin cancer rates across the country continue to rise? It is estimated that each day 9,500 individuals receive a skin cancer diagnosis. While surgery is a common …

To really understand the state of coworking space and its impact on modern society, Ergonomic Trends has compiled 32 of the most illuminating statistics on coworking spaces that will surprise …

Choosing the best country for outsourcing is a very important step on the road to choosing a vendor. So if you want to try IT outsourcing, Eastern Europe is a …

Ever wonder how many calories are in your favorite brunch drink? Are you drinking your veggies during unlimited Bloody Mary‘s or are you drinking 2 months worth of calories during …